
In September 2025, we added queueLength and queueLengthHistogram to the AggregateByPath endpoint. We've now added stopCountDistribution, which tells you how many times vehicles had to stop along your linestring.
How it is measured
Similar to queuing, a stop is registered when a vehicle's speed drops to ≤5km/h (or ≤3mph). While queueLength measures the distance from that point, stopCountDistribution counts how many times it happens while traversing the linestring.
Each time a vehicle's speed is below the threshold and then returns above it counts as one stop.
This is calculated for the total, hourOfDay, dayofWeek, distanceAlongPath and vehicleType aggregates.
What do I need to do to receive stop counts?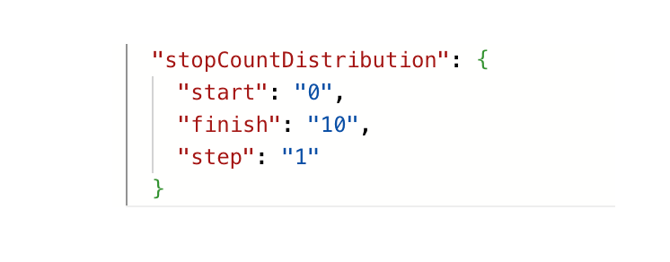 Before getting
 stopCountDistribution in your response, you’ll need to complete the stopCountDistribution in your request, where:
startis the lowest value you want the stop count information to begin.finishis the highest value you want the stop count information to end.stepis the increment or range. For example, if I put 1, this means distributions will be in 1-stop increments. So, 0-1, 1-2, 2-3 and so on.
What does each part of the response mean?
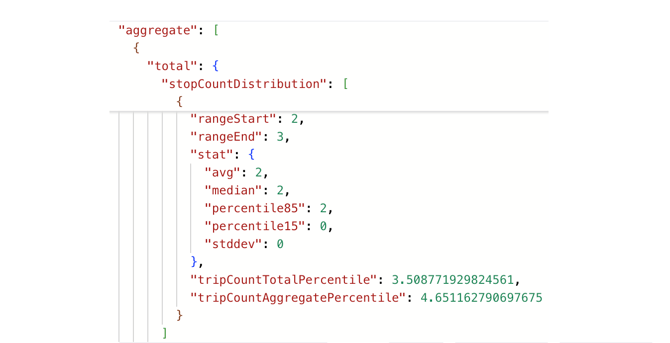
You will receive stopCountDistribution for the total, hourOfDay, dayOfWeek, distanceAlongPath and vehicleType aggregates. It follows the same structure as the other distribution fields in the response:
tripCountAggregatePercentileis the percentage of trips with that stop count versus trips in the current aggregate.tripCountTotalPercentileis the percentage of trips with that stop count versus trips across the whole linestring.startandfinishdefine the distribution range.statis the result for the aforementioned distribution range, with the average, median, 85th percentile and 15th percentile stop count, and standard deviation of all stops.
What can I use this for?
This is designed ot be read alongside queue length and is a useful measure of intersection performance and signal coordination. For example, long queues with mostly single stops mean traffic banks up but clears on the next phase. Whereas long queues with multiple stops mean traffic banks up and potentially experiences split failures.