
We also covered queue lengths in our September API updates
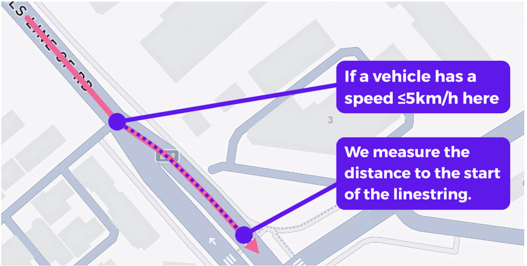
The queue length export feature allows users to understand queue length at an intersection. Queueing is identified when a packet in a linestring has a speed less than or equal to 5km/h. It provides aggregate information about the queue length, such as the average, median, 85th and 15th percentile, and it’s standard deviation. From this point, the queue is measured (in metres) up to the end of the linestring.
There are two parts to successfully use the queue length feature:
1. Making a selection
2. Downloading and interpreting the results
Making a Selection
To make a selection, open the Path Analysis tool and navigate to the location where you want to measure queue length. Select the date range you'd like and then select the 'Path' button in the Path dialogue box to start selecting a section of road.
The results of the queue length feature will depend on the accuracy of your path selection; make sure that your selection touches the white stop line of the intersection that you want to analyse. If your selection goes beyond the stopline and through the intersection or ends before the stopline, your results may not be accurate. We also recommend using satellite view or the Nearmap API to get a better view of the intersection you want to analyse.
 Make sure your path selection only includes one intersection. We determine queue length using changes in speed along the linestring, not the location of intersections. If you draw a linestring that crosses two or more intersections, the platform will calculate any queuing from any other intersection and 'skew the queue'.
 Once you have selected your linestrings, press the Analyse Paths button to view the results.
Downloading and interpreting results
In the results panel, you can download your queue length data via the Export File button, located at the top right-hand side.
Select the 'Download .csv' option to download your .csv file results. Note that there is currently no graph for queue length. If you don't see the option to download a .csv file, check that 'Advanced mode' is turned ON in your profile settings. Profile settings are located at the top right-hand corner under the profile icon.
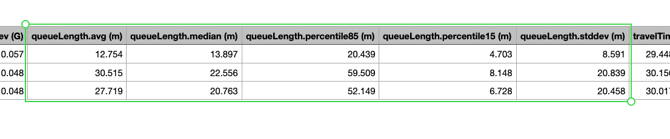
In the .csv download, there are 5 queue length columns. These columns include:
- Average (m)
- Median (m)
- 85th Percentile (m)
- 15th Percentile (m)
- Standard Deviation (m)
Below is an image of what these columns may look like in your exported .csv file. There is one vehicle type per row: CAR, HCV, and ALL vehicles. In this example, we can see that the average queue length is 12.754m for CARs and 30.515m for HCVs.
Troubleshooting Tips
To ensure reliable results, there are three things we recommend:
- One Intersection. Make sure your path selection only goes through one intersection. If you draw a linestring that crosses two or more intersections, the platform will calculate the queue across the whole linestring, not just the intersection you want to analyse and 'skew the queue'.
- Drawing to the stop line. The platform will calculate the queue length from the beginning of the arrowhead on your chosen selection. To make sure you get accurate results, your path selection should stop at the white stop line, or as close as possible, at the intersection of interest. Drawing a selection over the white stop line into the intersection or too far back from the stop line will calculate the queue length from the point you have selected, even if it is not the true stop line.
- Use satellite or map intergrations like Nearmap. These help provide more accurate selections as they allow you to see photos of where white stop line is located at an intersection.