
Like most authorities, Wiltshire Council relies on reports from residents, collision data and manual site visits to flag safety concerns. The limitation is timing. Collision records are retrospective, and a site visit only captures traffic behaviour in specific moments.
The Council had received reports that drivers were failing to stop or slow at the junction of Bratton Road and Trowbridge Road:
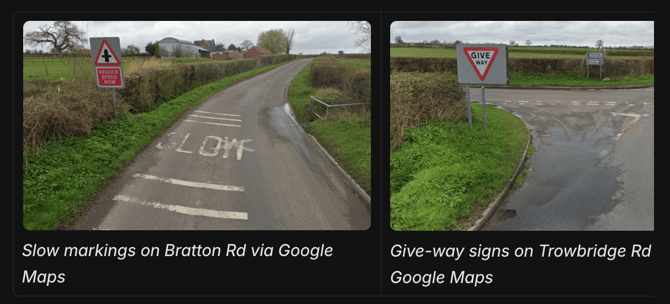
- Bratton Road is the priority carriageway through the junction - it has right of way, and is guided by ‘SLOW’ markings on approach.
- Trowbridge Road is give-way controlled and should yield to oncoming traffic.
Wiltshire wanted to know whether the reports held up, what was causing the non-compliance, and how they might intervene.
Using Path Analysis, they compared all four approaches (northbound, southbound, westbound and eastbound through the junction) across matching seasonal windows (1 March - 11 July) in 2024, 2025, and 2026.
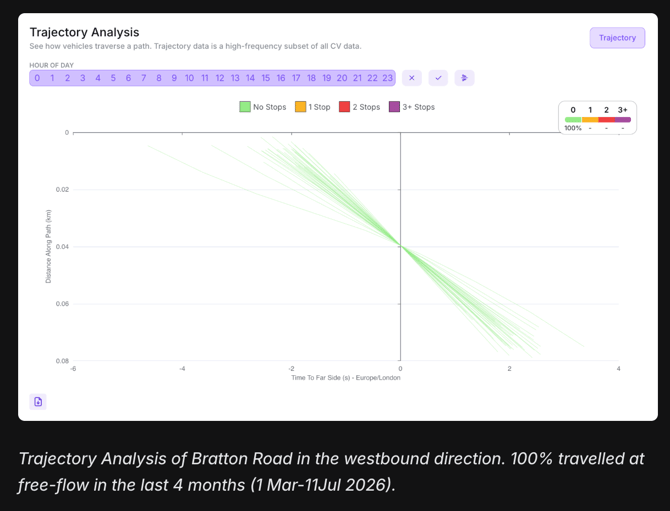
Bratton Road ran at free-flow with:
- 85th percentile speeds of 43.5mph (70km/h) westbound and 42.9mph (69km/h) eastbound over the most recent window (only 1–2mph higher in 2024 and 2025).
- Trajectories showed effectively every vehicle passing straight through without coming to a complete stop.
Trowbridge Road showed:
- A 15th percentile speed of about 3mph (5km/h) for drivers who did stop, against an 85th percentile near 21mph (34km/h) for drivers who did not.
- Measured along the approach, 85th percentile speeds rose towards the give-way line rather than falling.
- The speed distribution shifted into higher bands in 2026 than in previous years.
Speed distributions for northbound traffic across 2024, 2025 and 2026. The pink columns indicate 2026 data, and are higher compared to previous years for speeds above 19mph (31km/h).
Braking g-forces showed the most concerning conflict point:
- On the Trowbridge Rd give-way approaches, harsh braking roughly quadrupled. Northbound it climbed from 5% of braking in 2024 to 21% in 2026. Southbound increased from 3% to 22%.
- On the Bratton Rd priority carriageway, harsh braking appeared for the first time. Westbound went from none in 2024 and 2025 to 16% in 2026, with more than half of that (8%) in the most severe 0.4–0.5G band. Eastbound reached 3%. The traffic that had right of way was increasingly having to brake hard.
Pictured above is a bar chart and table showing the increase in harsh g-force distributions for all approaches to the junction across 2024, 2025 and 2026.
NOTE: G-forces are measured in small increments. The further a value is from 0 (even at small magnitudes) the more intense the manoeuvre. Learn more here.
Pairing these insights with imagery from connected vehicles revealed a likely cause. Comparing a Google Maps view from March 2024 to connected vehicle imagery from July 2026 showed the roadside vegetation had grown out substantially, obscuring the drivers' view (see below).
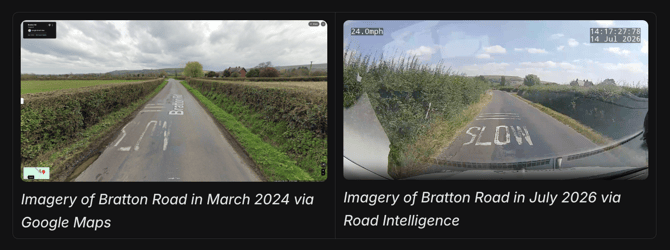
Without being able to see oncoming traffic at the point at which a give-way decision must be made, this was likely the cause of late and harsh braking.
This gave Wiltshire a complete picture of what was happening and why, assembled without repeated site visits. With that evidence, the Council trimmed the vegetation, improving driver visibility and re-exposing signage.