Using Z-Acceleration data (i.e., vertical vehicle displacement), several states were able to measure how violently vehicles moved up and down on a road. The output was broken down into 20m sections, represented by the Open Street Map ID of each segment.
Standard deviation in Z acceleration, or difference of 25th and 75th Z acceleration are used to determine whether the section has a large fluctuation in Z acceleration to indicate the possibility of road defects or traffic infrastructure that could impact z-acceleration (e.g., Raised wombat crossings).
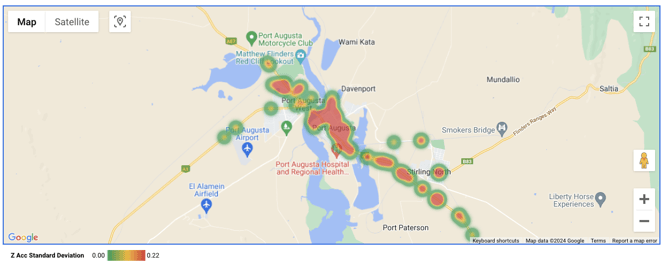
For example, below is a z-acceleration heatmap, identifying the location of road damage, potholes, and traffic infrastructure that may cause changes in the intensity of change in vertical acceleration. Specifically, this dashboard focuses on roads around Port Botany, NSW.
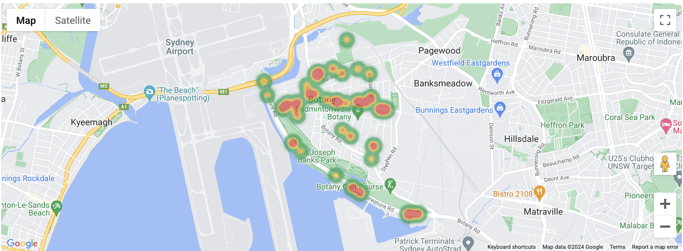
TfNSW and others with similar dashboards can then zoom into sections of the road network identified on the heatmap and use Google Street View to view defects of infrastructure that may have caused the change in z-acceleration.