
In Torquay, Victoria, Fischer Street is a key north-south corridor with a history of safety issues. Between 2017 and 2022, there were 12 recorded crashes, seven involving cyclists.
Supported by the Transport Accident Commission (TAC) and federal Black Spot funding, Surf Coast Shire installed a Dutch-style roundabout to protect vulnerable road users and encourage active travel. This roundabout design moves cyclists alongside pedestrians, off the main road and out of vehicles' path. Zebra crossings at each entry and exit point also ensure drivers give priority to pedestrians and cyclists, increasing awareness and encouraging slower vehicle speeds.
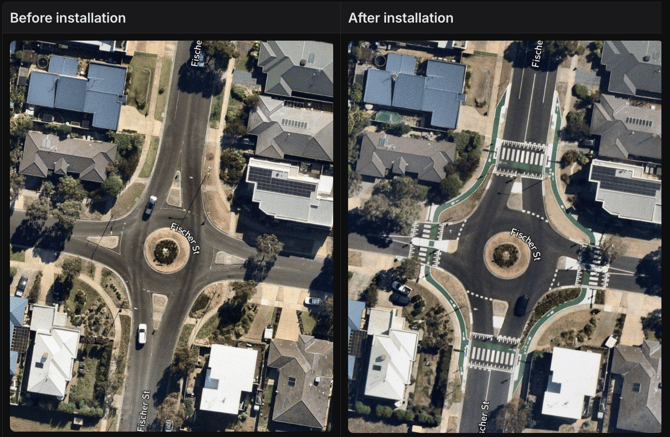
Image credit: Nearmap
Using See.Sense cyclist data alongside Compass vehicle data, Surf Coast Shire compared behaviours to understand how collision risk and driver safety changed.
Comparing before (1 Sep 2023 - 16 Jun 2024) and after (1 Aug 2024 - 18 May 2025), revealed a significant decrease in vehicle speeds, without impacting congestion or travel times, which remained consistent at 12-13 seconds.
-
For cars travelling northbound on Fischer Street through the roundabout, average speeds decreased by ~8km/h (~5mph), and 85th percentile speeds decreased by 3.5km/h (~2mph). Meanwhile, median and 15th percentile speeds decreased by up to 10km/h (~6mph).
-
For cars travelling southbound on Fischer Street through the roundabout, average speeds reduced by ~7.5km/h (~4mph), and 85th percentile speeds decreased by 5km/h (~3mph). Meanwhile, median and 15th percentile speeds decreased by 9km/h (~5mph).
.png?width=670&height=307&name=image%20(12).png)
The above Speed over Distance graph shows that as northbound cars approach the roundabout, median speeds reduced from 34km/h (~21mph) to 26km/h (~16mph). Note: the pink line is before the change, and the yellow line is after.
Speed Bins also reflected these changes. For example, fewer northbound cars travelled at 40-50km/h (~24 -31mph) through the roundabout, and there was a total reduction travelling at 50-60km/h (~31-37mph). This indicates that the roundabout effectively moderated speeds, with most northbound traffic travelling at 20-40km/h (~12- 24mph) through the roundabout.
.png?width=670&height=443&name=image%20(13).png)
The above Speed Bins show that after the change, the proportion of northbound cars travelling at high speeds significantly reduced. Delta measures the "change in" between the two percentages; the study used relative delta (to make it a percentage value) rather than an absolute delta, which would only minus the two values. Note: the pink is before the change, and the yellow is after.
G-force Bins also showed a reduction in the overall intensity of steering-related g-forces. These swerving g-forces indicate how intensely vehicles are steering or moving laterally.
G-forces are measured in small increments. The further a value is from 0 (even at small magnitudes) the more intense the manoeuvre. As a reference, we constantly experience 1G (9.8m/s²) at Earth’s surface due to gravity.
.png?width=436&height=439&name=Untitled%20design%20(4).png)
For northbound cars on Fischers Street, the intensity of rightward swerving decreased as they approached the roundabout along the straight road (see the table below).
.png?width=670&height=164&name=image%20(14).png)
For example, northbound cars in the 0.2G-0.3G range were reduced by ~69%. This analysis shows the roundabout reduced speeds and swerving. These insights help inform Surf Coast Shire's future active travel changes and demonstrate how such changes can enhance safety while maintaining efficient network performance.
To learn more about this case study, includng the results from the cycling data, watch the recording of our February 2026 Australaisan User Group.