
What's on this page?
- Map Page features
- Search and tool selection
- File upload
-
- Map features and functionality
- Help and support
- Tools and Interpreting Results
- Path analysis
- Origin-Destination
- Near Misses
- Real-Time Trajectory
Home Page View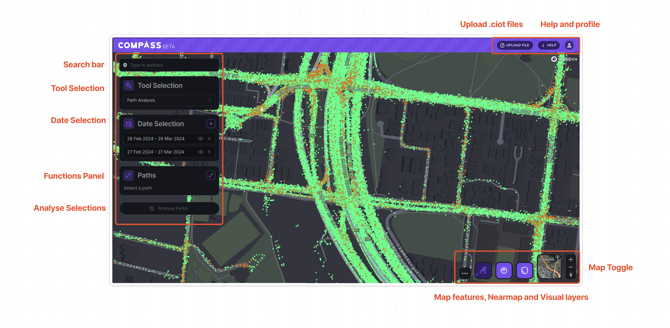
Search Bar
To select a location on the map, you can type the road name, latitude and longitude, LGA, or location of interest by typing it directly into the Search Bar at the top left corner of the map. Alternatively, you can manually scroll and zoom on the map to find points of interest.
Tool Selection
Select one of four tools from the drop-down list. An in-depth explanation of each tool and their features is outlined further down in this document. Here's a short overview of what each tool does:
- Path analysis - Allows you to select any section of road to see data about those selections
- Origin-Destination - Shows travel data between and within selected zones.
- Near-misses - Download information about friction loss events within a selected polygon
- Real-Time Trajectory - View real-time trajectory information for corridors
Date Selection
To add a date range, click the [+ Add Selection] button located in the Date selection box under the search bar.
To change the date range, click the date range you want to edit. It will open the calendar tool.
Click once to select a start date, and click once more on your end date. The date range you have selected will appear in the Road Selection Panel by displaying the day, month, and year.
You can select multiple date ranges at once or double-click on one day to see a single-day date range. Here, you can also select what days of the week or hours of the day you'd like to see data for.
To delete a date range, press the [x] button. Toggle a date range on or off without deleting it by pressing the eye icon.

Measurement settings
Switch between imperial and metric measurement settings. This can be found under the profile icon at the top right-hand side of the browser window. The platform remembers these settings so there's no need to change them every time you login. Any updates to speed or distance metrics are dynamic - they will happen without you having to requery or reload the platform.

Functions Panel
The functions panel is where you can select zones, paths, or input WKT files.
It is a dynamic panel; The name of the function panel changes depending on the tool you are using. For example, if you are using Path Analysis, the functions panel will be called 'Paths', whereas if you are using the Origin-Destination tool, the functions panel will be called 'Zones'.


Here's a cheat sheet that helps identify what functions the different tools have:
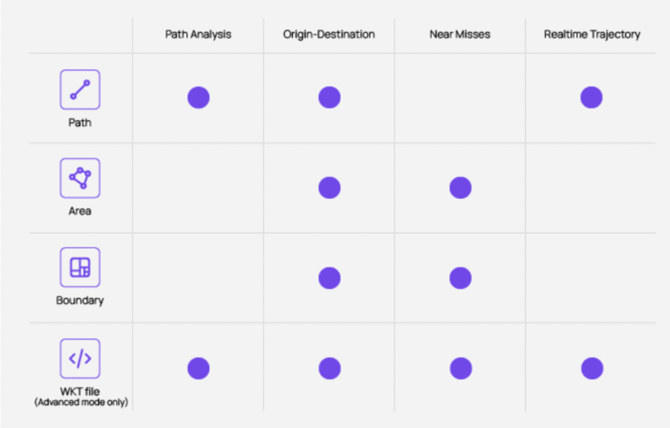
Analyse Selections
Pressing the Analyse Selection button will generate results for any selections, WKT, or polygons you have created on the map. This will cause the Results Panel to open and display results for your selections.
Upload Files
If you have previously saved work on the platform in the form of a .ciot file, you can re-upload it to show all your previous selections without having to do the same query again. .Ciot files are our version of a 'save file'. They can be opened at a later date to continue where you left off, or shared with other Compass users.
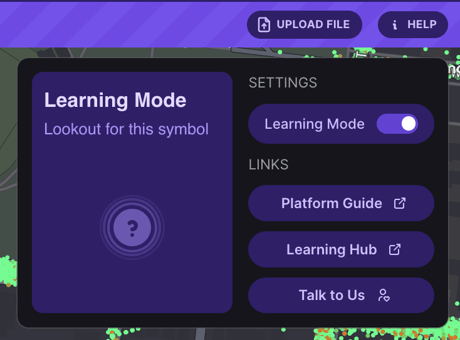
Help Functions
Under the Help button you will find Learning Mode and links to contact us and platform how-to guides (like this one!).
.gif?width=349&height=336&name=Untitled%20design%20(9).gif)
We strongly encourage new users to turn on Learning Mode while getting used to the different platform features.
Learning Mode enables pop-ups that help guide you through how to use different tools without having to leave the platform and go to our Knowledge Hub. These can be collapsed so that they don't interfere with your map,without turning off future tips and tricks.
They include step-by-step instructions and .gifs to demonstrate how to use different tools.
Profile Functions
The profile button allows you to turn on Advanced View, toggle between Dark and Light mode, change measurement settings, and toggle between Simple and Detailed map views. Simple map view will remove map features such as shadows and trees.
Advanced View allows you to upload WKT files. A new WKT file button will appear in the Features Panel. You can read more about the advanced WKT feature here.
Map Toggle
Map View Toggle allows you to switch between map and satellite view. 
Visual Layers
There are two visual layers in the platform:
- Near misses - shows friction-loss events
- G-force and Speed - shows a heatmap of the top 15th percentile of g-force data.
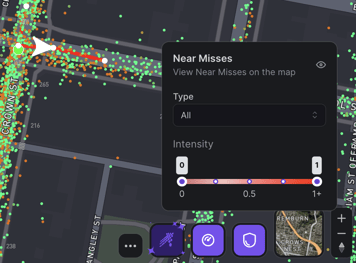
For Near Misses, there are 2 filtering options
Type Filters
You can filter near-misses by whether they are caused by hard steering, hard braking, or a combination of both factors.
Intensity Filters
You can filter near-misses by the violence of a near-miss or crash by changing the parameters for the upper and lower thresholds you want to view. You are able to view data points that have an intensity of between 0 and 7.
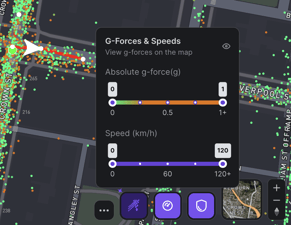
For G-forces and Speeds, there are 2 filtering options:
Absolute g-force (g)
Filter by severity of g-forces between 0 and +1.0
Speed (km/h)
Filter by vehicle speed between 0 and
+120km/h
Nearmap Imagery
Compass now supports a Nearmap Imagery integration to allow users of Nearmap to access high-resolution vertical, oblique, and panoramic aerial imagery in Compass Road Intelligence. The imagery is available to users across Australia, New Zealand, and North America. Read the full article about the Nearmap integration here.
The integration provides better visuals across the road network to understand changes to road and roadside infrastructure or temporary traffic measures.
.gif?width=670&height=377&name=YT%20thumbnails%20+%20gifs%20(4).gif)
If you would like access to the Nearmap feature or obtain a license, please reach out to info@compassiot.com.au to use this feature.
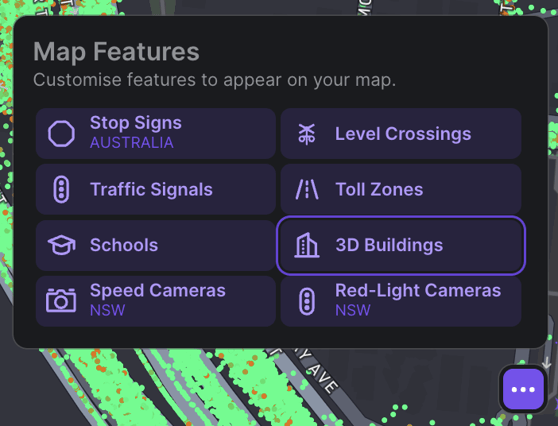
Map Features
There are 8 map features that you can toggle on and off. You can have multiple features on at the same time:
- Stop Signs (Australia) - Location of stop signs
- Traffic Signals - Location of signalised intersections
- Schools - School locations. Note that this is not school zones, just the school locations
- Level Crossings - includes rail, trams, and lightrails
- Toll Roads - Shows location of all toll roads
- 3d Buildings - Ability to view building density and height
- Speed Cameras (NSW) - Location of speed cameras in NSW only
- Red Light Cameras (NSW) - Location of Red Light cameras in NSW only
Tool Selection
Path Analysis
To select a road, click the [Add Path] button located in the Path selection box. This will allow you to select roads on the map.
%20(1).png?width=327&height=127&name=Road%20Intelligence%20(2)%20(1).png)
To make a selection on the map, click once on the road of interest to set an origin point and double-click to select a destination point. To make more complex selections (i.e., a trip with specific turns), you can make a series of single clicks, and then double-click when you've finalised your selection. Make sure your selection accounts for the direction of traffic you are trying to analyse.
If you make a mistake, you can cancel a selection in the Paths Panel by clicking the [x] button next to the corresponding road you wish to delete. The road names and map arrows are colour-coded for ease.
If you are making multiple road selections, you can click the name of the road in the Paths panel and it will zoom in to that particular selection.
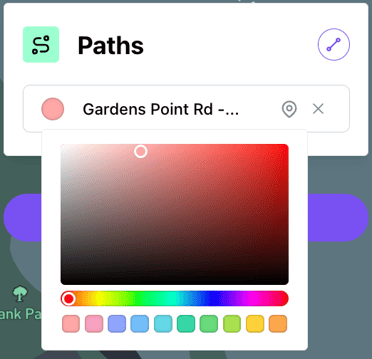
You can also change the colour of your selections to personalise them by clicking on the coloured dot next to the road name.
Tip: Don't forget to take into account the directional flow of traffic when making a selection. If you make a selection that goes against the flow of traffic, the platform will automatically re-route your selection so that it travels with the flow of traffic. Here's an example of what it looks like on the map when you make a selection against the traffic flow in Redfern Lane, a one-way street.
The platform has automatically re-routed the selection around the nearest cross-streets:

To view data on a road(s) you've selected, press the [Analyse Paths] button located underneath the Path Selection panel. This will automatically load data for your selections via the Results Panel, located on the right-hand side of the screen.
If the Results Panel does not automatically load, you can open it by selecting the [View Results] button that will replace the [Analyse Paths] button once the query has finished loading.
.gif?width=670&height=377&name=YT%20thumbnails%20+%20gifs%20(2).gif) The Results Panel displays information about the speed and volume of your selections. You also have the option to compare multiple roads side-by-side, or one at a time.
The Results Panel displays information about the speed and volume of your selections. You also have the option to compare multiple roads side-by-side, or one at a time.
To view data for a single road and date range, make your road and date selections by using the drop-down selections on the top left-hand corner of the Results Panel.
To compare road data, click different roads and dates located at the top of the Road Query Panel. You can select what roads and date ranges you want to compare by choosing them via the drop-down lists.
You are able to:
- Compare different roads for the same date range
- Compare different roads for different date ranges
- Compare the same road for different date ranges
- Compare vehicle types between cars and Heavy Commercial Vehicles (HCVs)

To download .ciot files or .csv files, press the export data button. You can download data for only one selection or all selected routes. You can also view your road selections in Google Maps by clicking the [View on Maps] button.
.gif?width=670&height=377&name=YT%20thumbnails%20+%20gifs%20(3).gif)
Graphs included in the Path Analysis Result section
Speeds
- Speed over Distance (previously 'Chainage')
- Speed over Time
- 'All' graphs that show a Confidence interval of 15th, average, and 85th percentile speeds
- Speed Bins (table and graph formats)
G-forces
- G-force over distance for total, braking, swerving, and acceleration
- G-force matrix
- 'All' graphs that show a Confidence interval of 15th, average, and 85th percentile g-forces
Others
- Trajectory
- Average Travel Time
Origin-Destination Tool
The Origin-Destination tool shows data about travel behaviour between and within selected zones. It provides a breakdown of each of these options by different vehicle types.
To select a zone, click the [Zone Selection] button in the Zone Selection Panel. Users can select:
- a straight line (the button on the left side with the two dots on either side of a line)
- A polygon area (the button on the right with multiple dots in a group)
- A pre-defined Boundary (i.e., SA1 to SA4, postcode, LGAs, LADs etc)
To make a selection, click once to place a dot. Repeat this process of placing dots until you have created your desired zone. To finalise your zone selection, double-click on the last dot to generate either your line or polygon.
Below is an example of how to select free-form polygon zone and pre-defined boundaries. Note the double-click at the end to finalise the free-form polygon selection:
%20(7)%20(1)-gif.gif?width=670&height=934&name=date%20filters%20(2280%20%C3%97%201280px)%20(7)%20(1)-gif.gif)
If using a pre-defined boundary, simply select the boundary type from the Boundary list and click on one of the highlighted boundary areas.

Near miss Tool
You might notice there is a Near Miss Tool and a Near Miss Visual layer. The difference between the two is as follows:
- Near Miss Visual Layer — Allows users to view near-misses for the date periods selected without exporting the data. This updates dynamically based on the time periods you select in the Date & Time panel.
- Near Miss Tool — Allows users to export all near-misses in a selected geographical area or polygon, selected via the Zones panel.
A near-miss identifies where drivers are losing friction with the road surface, resulting in harsh braking or swerving readings. They act as a leading indicator for safety risks, identifying where potentially high-risk intersections or roads exist across a transport network. A near-miss is not the same thing as an actual crash.
Near misses appear as red dots on the map. Clicking on one of the dots will provide 6 seconds of data for each near miss - 3 seconds before and 3 seconds after. A dialogue box with additional data about each specific near miss will appear on the top righthand corner once a dot is selected.

To download near-miss data for a specific area, select a pre-defined boundary or create a freeform polygon zone.
Tip: You might notice that the individual data points are different shades of red. This is used to further differentiate accidents with higher G-force readings - the darker the red, the more intense the G-force.
Real-Time Trajectory
We've added a real-time trajectory tool to Compass Road Intelligence. You can find Real-Time Trajectory data under the new Trajectory Tool. The tool works best for long selections on divided and/or large arterial roads.
.png?width=670&height=291&name=Untitled%20(27).png)
As vehicles travel down the selected path, they leave traces in real-time, represented by the solid lines. Historical trajectory data is also presented on the graph, in the form of dotted lines. These help identify historical traffic conditions for the selection based on data from one week before the date you view. This is labelled 'Control Data' in the left-hand corner of the results panel; this date cannot be changed in the first release.
The black vertical line is the actual time of day that the user is viewing the data. This line will move and trips will appear as real-time data renders on the graph.
.png?width=670&height=330&name=Untitled%20(26).png)
Below is an example of historical data (faded dotted lines representing data from the week prior) and real-time data (solid lines). Sometimes, a gap will appear between the real-time trip lines and the black line indicating the current time. This indicates the delay in real-time data updating on the front end.
.gif?width=670&height=335&name=Untitled%20design%20(6).gif)
By default, the platform selects the posted speed limit as 100km/h. You can adjust this based on the road you have selected as vehicle speed is colour-coded relative to the speed limit. Red and orange are when vehicles are going slower and where queues are likely to be forming.
Real-time can only support one path selection at a time.