
New Features
- Splice Feature for splitting long path selections in Path Analysis
- Near-Miss Colour change
- GEOJSON Export
- Compass Academy for better product guides
Bug Fixes
- Speed limit conversions
- Timezones in G-force graphs
- Origin-Destination Edge percentage
- Rejecting intersecting polygons.
New Features
Long Selection Splicing Feature
In Path Analysis, large path selections or linestrings are difficult to provide accurate data for since they require a "full-match". A full-match means a vehicle must have travelled the selected path in its entirety. Sometimes, this does not serve use cases very well. For these cases, we now offer a splice feature. The feature lets you cut up a selection into multiple, smaller linestrings at the click of a button.
When you make a selection over 5km (3mi), a warning alert will appear at the top right-hand side of the map. If you have more than one selection, the linestring that has exceeded the recommended selection length will appear orange in the Path Selection dialogue box.
-1.gif?width=670&height=312&name=Untitled%20design%20(10)-1.gif)
These smaller selections are equal in distance, except for the final section, which will be whatever distance is remaining. Hovering over the split linestrings in the Path Selection dialogue box will tell you how long each new section is.

Note that the splicing recommendation does not apply to Real-Time Trajectory, which works best with longer linestring selections.
Change to Near-Miss Colours
Clicking on a Near-Miss now generates a purple line instead of a red one to connect points associated with an event. Each associated point is visualised as a white dot with a purple outline, except the event itself, which is a larger dot with a red outline.

Arrows are now outlined for higher contrast with the map. Hovering over each point in the linestring will reveal information about the acceleration, speed and time of the event.
GeoJSON Export Option
Users can now export features as GeoJSON, which preserves metadata properties such as the selection mode, boundaries, label, and colour of the selection. This means a GeoJSON file can be passed on to our Data Science team for queries that need extra assistance, because they can import this directly into their workflow. This feature is available in Advanced Mode along with the WKT export feature.
What's the difference between WKT and GeoJSON? WKT is a pure string format so it can only store the geometry information. A GeoJSON supports metadata like colours, names, etc.
Please note that GeoJSON files cannot be uploaded or imported back into the platform.
Compass Academy
You've likely seen a mention of our new Compass Academy. The Academy is a rework of our Quick Start guide video, based on feedback that the video was too long. The Academy breaks down the different functions of the platform for basic and advanced users, as well as some tutorials.
The Academy is now linked under our 'Help' button, located in the top right-hand menu bar. We've also changed the icon for the learning hub so it's easier to identify.

New Area Measurement Setting
We've added the abilty to toggle between Metric and Imperial measurements for area. This is mainly for boundaries of polygons in the Near-Miss and Origin-Destination tools. You can now select between Square Meters, Square Kilometers, or Square Miles.

Fixes
Speed Limits
The platform will attempt, where possible, to round mph speeds to the nearest whole number instead of a raw conversion from km/h. This is to help minimise results displaying odd decimal speed readings.
Below is an example of a before (left) and after (right) where the speed has been rounded up from 19.88mph to 20mph.

Timezone in G-Force Chart
G-Force charts now include a timezone check, which scales the data into the timezone of the selected feature. Below is an example from a trajectory graph X-axis, displaying 'Australia/Sydney' as the timezone.
![]()
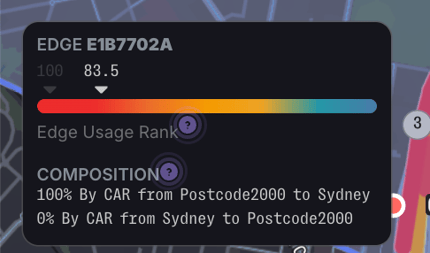
OD Edge Percentage
The edge percentages in the Origin-Destination tool were misrepresentative of the data over the edge due to factors like multiple vehicle types, dates, and features. This resulted in a percentage higher than 100% when describing the quantity of trips travelling through the edge. This has been removed from the platform as it does not accurately portray the relative volumes. Instead, please refer to the the Edge Usage Ranking (EUR) score for this instead. Below is an example of an EUR output in the Origin- Destination tool.
Reject Intersecting Polygons
The platform will now automatically reject polygons that cross over themselves. This is where the polygon's perimeter intersects itself, as seen below:
.gif?width=670&height=312&name=Untitled%20design%20(11).gif)
This will trigger an intersection error, advising you to try a different selection. This improves on the previous error messaging that provided a generic alert.
Improved Error Messaging
We've updated error messaging to be more specific and to persist for longer on the screen. Previous error messages were sometimes vague or disappeared too quickly before a user could report or record them.