
The Victorian Department of Transport and Planning wanted to understand the effect of major road closures. Specifically, they wanted to understand where likely pressure points would be on the network as a result of closures and better analyse and plan future closures while minimising disruption to traffic.
Previously, information about road closures was collected via Bluetooth sniffers. However, it's not viable to install these devices at every intersection. Connected vehicle data provides an alternative solution to monitor before, during, and after a road closure without installing additional hardware.
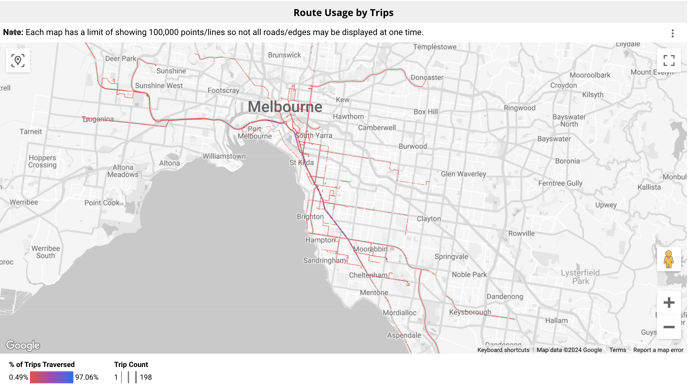
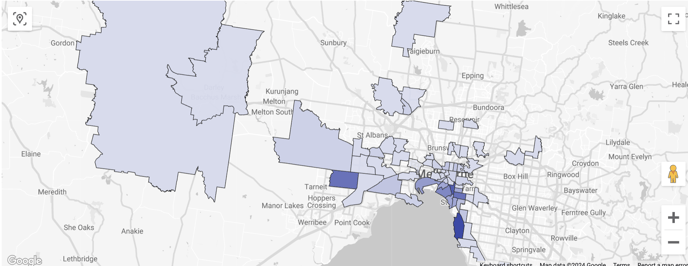
Using this information, the operations team could see which routes may be impacted the most once the segment of St Kilda Road is closed off. The dashboard also helped them understand where these trips start from and end up in terms of SA2 and road level.
The result of this project was a Road Closure Template that will be used to analyse and plan road closures across the state of Victoria.