
New Features
Date Exclusions and Updated UI
We've made some changes to the date selector UI. The function is relatively the same, we've just changed how it looks to make it easier to identify the date ranges you have picked. You are still able to exclude days of the week and hours of the day by using the Date Options and Time Options drop-downs.

We've also added the ability to exclude dates from a selected range. The Date Options drop-down has an exclusion feature that allows you to remove dates while still getting data for the rest of the dates within your range. This is useful when you want to exclude school holidays or public holidays.
For example, if you have chosen your date range as 1st Jan - 20th Jan 2025 but you want to exclude the Australia Day long weekend, you can exclude the 25 - 27th Jan. You can also exclude a single date by double-clicking on it.
To enable the Date Exclusion feature:
- Navigate to the profile icon at the top right-hand corner of the screen
- Turn
ONAdmin Mode - Select an existing date range to edit it, or add a new one
- Under the 'Date Options' drop-down, you should now see an option to exclude dates.
Your excluded dates will appear as greyed-out squares in your original date range selection to indicate they have been excluded from the results. To remove a date range or date exclusion, click the x button. .gif?width=688&height=386&name=Untitled%20design%20(10).gif)
The exclusions will also appear in the Date Selection panel and the Results Panel when you hover over a date selection.

Updates and Bug Fixes
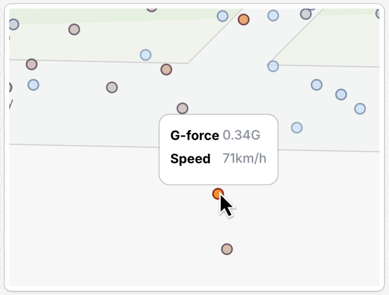
G-Force Popup on Hover
Added a Loading Spinner for large .CIOT files
When uploading larger V1 files, we will now show a loading screen to indicate progress. It is less prone to freezing the tab too. This most benefits large date range queries, or queries with many combinations of features and date ranges.

Date Range on Legend
Chainage and Speed-Bin charts in Path Analysis now feature a legend to indicate the date range of the series. This appears both in the tool-tip as you hover over the data, and on the top of the graph (legend). Allowing you to more quickly identify data.

Persisted Metric Selection
When switching between speed analysis tabs, your metric selection will stay the same, allowing you to more quickly compare. This applies for the All, Average, Median, 18th and 15th percentile selectors within the same box.
For example, if you have selected to view Median speeds, the platform will retain your Median speeds selection even if you click to view a different speed graph

Undefined Tooltip Content
Fixes a bug that caused tooltips to appear with undefined as opposed to the actual value. This has since been fixed, this does not require a re-query.
Chart Height
Changes the behaviour of the Path Analysis charts to no longer be pinned with a minimum value of zero. Now, they will size themselves dynamically to the content displayed within the chart.
Speed-Bin Chart Conversion Bug
The Speed-Bin summary performed its own conversion between different metrics that sometimes caused it to apply a conversion twice. This has been fixed.